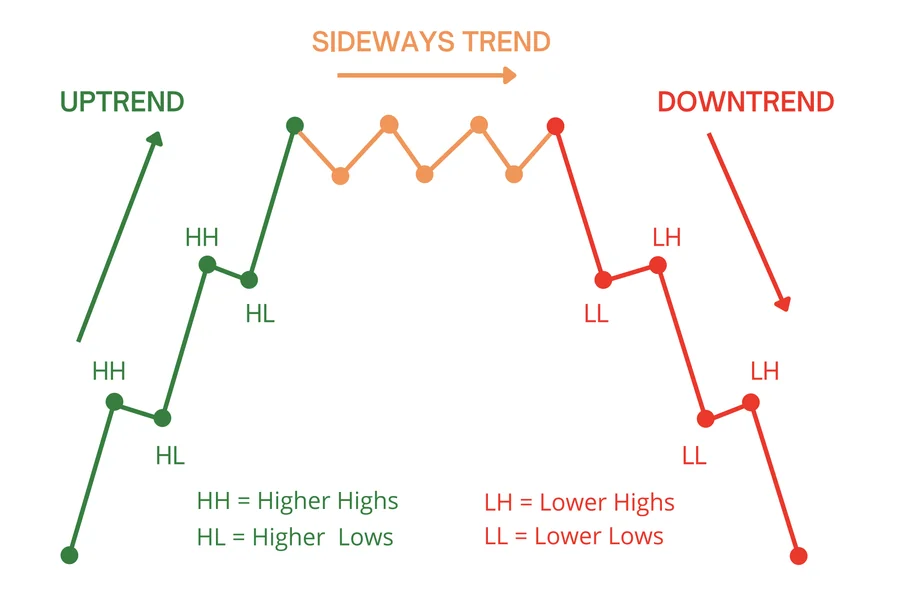
An inverse trend happens when one variable moves in the opposite direction from another. When one value rises, the other tends to fall. When the first value falls, the second may rise. This relationship appears in finance, economics, statistics, science, business, health research, and everyday decision-making.
Understanding an inverse trend can help you read charts, compare data, study relationships, and avoid wrong conclusions. It is especially useful when two metrics seem connected but move in different directions over time.
Featured Answer: What Is an Inverse Trend?
An inverse trend is a pattern where two related variables move in opposite directions. As one increases, the other tends to decrease. This does not always prove that one variable causes the other, but it can show a negative relationship that deserves closer study.
A simple example is price and demand. In many situations, as the price of a product increases, demand may decrease. That creates an inverse trend between price and demand.
Inverse Trend Quick Facts
| Feature | Details | Example |
| Basic Meaning | Two variables move in opposite directions | Price rises while demand falls |
| Common Data Pattern | Negative relationship | Higher speed, lower travel time |
| Chart Direction | Often downward from left to right | Negative slope |
| Main Use | Comparing connected variables | Sales vs price |
| Common Fields | Finance, economics, science, statistics | Interest rates and borrowing |
| Key Warning | Relationship does not prove causation | Correlation is not causation |
| Main Keyword | inverse trend | Opposite movement |
Why an Inverse Trend Matters
An inverse trend can make data easier to understand because it shows that two values are not moving together. Instead, one tends to rise while the other falls.
This can be useful for analysts, students, business owners, investors, researchers, and anyone who works with data. A clear inverse trend may help reveal pressure points, trade-offs, and changes in behavior.
For example, a company may notice that as product prices rise, order volume falls. A health researcher may see that as exercise time rises, resting heart rate falls in a group. A driver may see that as average speed increases, travel time decreases.
In each case, the inverse trend gives a useful starting point for deeper analysis.
Types of Inverse Trend
The exact form of an inverse trend can vary. Some relationships are strong and consistent. Others are weak or only visible over a limited range.
Linear Inverse Trend
A linear inverse trend appears when one variable tends to fall at a fairly steady rate as another rises.
On a scatter plot, the points may form a downward pattern from left to right.
Examples can include:
- Higher prices and lower demand
- Greater distance from a signal source and lower signal strength
- Higher speed and shorter travel time under fixed conditions
- More defects removed and fewer quality complaints
A linear inverse trend is often easier to identify visually than a complex relationship.
Nonlinear Inverse Trend
A nonlinear inverse trend still moves in opposite directions, but not at a constant rate.
For example, doubling one variable may not cut the other variable in half. The relationship can flatten, curve, or change speed as values move.
This type of inverse trend may appear in physics, engineering, economics, and biological systems.
Short-Term Inverse Trend
Sometimes an inverse trend appears only during a limited period.
A stock may rise while a related sector index falls for several weeks, but the relationship may not continue over a full year.
Short-term relationships should be studied carefully because temporary events can create misleading patterns.
Long-Term Inverse Trend
A long-term inverse trend develops over months or years and may be easier to trust if the pattern remains stable.
However, even a long-lasting inverse trend does not automatically prove cause and effect.
Inverse Trend Examples
A few examples can make the idea easier to understand.
Price and Demand
One of the most familiar examples of an inverse trend is the relationship between price and demand.
When price increases, some consumers may buy less. When price decreases, demand may rise.
This creates an inverse trend under many normal market conditions.
Speed and Travel Time
If distance stays the same, higher speed usually reduces travel time.
That means speed and travel time can show an inverse trend.
The relationship is not perfectly linear because traffic, road conditions, and stops may affect the result.
Interest Rates and Borrowing
When interest rates rise, borrowing can become more expensive. Some consumers and businesses may borrow less.
This can create an inverse trend between interest rates and borrowing activity.
The strength of the relationship depends on income, confidence, credit conditions, and other economic factors.
Supply and Price
In some markets, increasing supply can put downward pressure on price.
That can create an inverse trend between supply and price, especially when demand remains stable.
Exercise and Resting Heart Rate
In some populations, higher fitness levels may be associated with lower resting heart rate.
This can form an inverse trend, although health relationships depend on age, medication, fitness level, genetics, and other factors.
Altitude and Air Pressure
As altitude increases, atmospheric pressure generally decreases.
This is another example of an inverse trend that is easy to observe in science.
Inverse Trend vs Direct Trend
An inverse trend is different from a direct trend.
| Feature | Inverse Trend | Direct Trend |
| Movement | Opposite directions | Same direction |
| If X rises | Y tends to fall | Y tends to rise |
| If X falls | Y tends to rise | Y tends to fall |
| Typical slope | Negative | Positive |
| Example | Price and demand | Advertising and reach |
| Common term | Negative relationship | Positive relationship |
A direct trend means both variables generally move in the same direction. An inverse trend means they move in opposite directions.
Inverse Trend vs Negative Correlation
An inverse trend and negative correlation are closely related, but they are not always identical.
An inverse trend is a broad description of opposite movement between variables.
Negative correlation is a statistical measure that describes the strength and direction of a relationship.
A dataset can show an inverse trend without having a perfectly strong negative correlation. Real data often contains noise, exceptions, and outside influences.
How to Identify an Inverse Trend
You can identify an inverse trend by comparing how two variables change.
Look at Direction
Start by checking whether one variable rises while the other falls.
If this happens repeatedly, an inverse trend may be present.
Use a Scatter Plot
A scatter plot is one of the easiest tools for spotting an inverse trend.
If the points generally move downward from left to right, the relationship may be negative.
Compare Time Series
You can also compare two lines over time.
If one line often rises while the other falls, that may suggest an opposite pattern.
Calculate Correlation
A negative correlation coefficient can support the presence of an opposite pattern.
Values closer to -1 indicate a stronger negative linear relationship.
However, correlation should not be used alone. Always examine the data pattern and context.
What Can Cause an Opposite Pattern?
Opposite movement can appear for many reasons.
Cause and Effect
Sometimes one variable directly affects another.
For example, increasing speed can reduce travel time over a fixed distance.
Market Behavior
Consumer decisions can create opposite movement.
Higher prices may reduce demand because buyers become less willing or able to purchase.
Resource Limits
A fixed resource can force one quantity up while another goes down.
For example, if a fixed budget is divided between two categories, spending more on one can reduce spending on the other.
Mathematical Relationships
Some formulas naturally create opposite movement.
An inverse proportional relationship is one example where increasing one quantity reduces another.
External Factors
A third variable can make two values appear to move in opposite directions.
This is why opposite movement should not be treated as proof of causation without further analysis.
Opposite Trends in Finance
Opposite movement often appears in financial discussions.
Investors may compare:
- Bond prices and yields
- Interest rates and some borrowing activity
- Currency values and import costs
- Commodity supply and prices
- Risk sentiment and demand for defensive assets
In finance, these relationships can change quickly. Market connections can weaken, disappear, or reverse because of news, policy changes, liquidity, and investor behavior.
That is why financial decisions should never rely on a single opposite relationship alone.
Opposite Trends in Business
Businesses can use negative relationships to study performance.
Common examples include:
- Higher prices and lower sales volume
- Longer response times and lower customer satisfaction
- Higher defect rates and lower repeat purchases
- More automation and lower manual processing time
- Higher discount rates and lower profit margin
A business should confirm whether the pattern is consistent before changing strategy.
Opposite Trends in Science and Research
Researchers often study whether variables move in opposite directions.
Examples may appear in:
- Physics
- Chemistry
- Biology
- Environmental science
- Medicine
- Psychology
- Engineering
A researcher may notice an opposite pattern in early data, but the next step is usually testing whether the relationship remains after controlling for other factors.
Opposite Trends in Statistics
In statistics, opposite movement often appears as a negative association.
Analysts may use:
- Scatter plots
- Correlation coefficients
- Regression models
- Trend lines
- Time-series analysis
A visible opposite pattern can be useful, but statistical significance, sample size, outliers, and data quality also matter.
Common Mistakes When Reading Opposite Trends
| Mistake | Why It Matters | Better Approach |
| Assuming correlation proves causation | Two variables may share a third cause | Test other explanations |
| Using too little data | Small samples can mislead | Use enough observations |
| Ignoring outliers | Extreme values can distort the pattern | Review unusual points |
| Assuming the relationship never changes | Trends can weaken over time | Recheck the data regularly |
| Confusing inverse with opposite totals | Opposite movement is about direction | Compare changes carefully |
| Ignoring scale | Different axes can exaggerate movement | Use clear chart scales |
These mistakes can make an opposite pattern look stronger or weaker than it really is.
How to Measure an Opposite Trend
There are several ways to measure a negative relationship.
Correlation Coefficient
The correlation coefficient ranges from -1 to +1.
A negative value suggests opposite movement in a linear relationship.
A value near -1 indicates a strong negative relationship. A value near 0 indicates little linear relationship.
Regression Slope
A negative slope in a regression model may support opposite movement.
The size of the slope shows how much one variable tends to change as the other changes.
Percentage Change
You can compare percentage changes in two variables.
If one repeatedly increases while the other decreases, this can support a negative relationship.
Visual Inspection
Charts remain useful because they can reveal curves, breaks, clusters, and outliers that a single statistic may hide.
When Opposite Movement Can Be Misleading
Opposite movement can look convincing even when it is temporary or incomplete.
For example, two values may move in different directions for only a few observations. A major event may affect both variables differently. Seasonal patterns may also create an apparent negative relationship.
Always ask:
- How much data is available?
- Is the time period long enough?
- Are there outliers?
- Is another variable affecting both values?
- Does the relationship continue in other periods?
- Is the pattern linear or nonlinear?
These checks can help you avoid overinterpreting the relationship.
Keyword Variations
| Keyword Variation | Search Intent |
| opposite trend | General meaning |
| negative relationship | Related concept |
| negative correlation | Statistical concept |
| inverse relationship | Related meaning |
| opposite movement | General comparison |
| downward correlation | Data interpretation |
| negative trend chart | Visual explanation |
| inverse relationship in statistics | Statistical use |
People searching for this topic may want a definition, an example, a chart explanation, or a statistical meaning.
Google PAA Targeting Questions
| Question | Short Answer |
| What does an opposite trend mean? | It means two variables usually move in different directions, with one rising while the other falls. |
| Is an opposite trend the same as negative correlation? | They are related, but negative correlation is a statistical measure while opposite movement is a broader description. |
| What is an example of opposite movement? | Price and demand often move differently because higher prices can reduce the amount consumers choose to buy. |
| How do you identify opposite movement? | Look for repeated different-direction movement, a downward scatter plot pattern, or negative correlation between two variables. |
| Does opposite movement prove causation? | No. It shows association, but outside factors may influence both variables and create the observed pattern. |
| Can an opposite relationship be nonlinear? | Yes. The relationship can curve or change rate while still showing different directional movement between two variables. |
Why Opposite Relationships Can Change Over Time
A negative relationship is not always permanent.
Markets, technology, consumer behavior, regulations, and outside conditions can change the connection between variables.
For example, the relationship between price and demand may weaken if a product becomes essential or if buyers have no substitutes.
A relationship that looked strong last year may be weaker now.
This is why data should be reviewed regularly.
How to Use Opposite Movement in Decision-Making
A negative relationship can support decisions, but it should not be the only input.
Use it to:
- Spot possible trade-offs
- Compare performance metrics
- Test assumptions
- Build forecasts
- Identify unusual changes
- Create hypotheses for further study
A useful negative pattern can guide questions, but strong decisions require context, quality data, and additional evidence.
Final Thoughts
Opposite movement between variables is a simple but important data concept. It describes a relationship where two values tend to move in different directions.
You may see this pattern in price and demand, speed and travel time, altitude and air pressure, interest rates and borrowing, or many other areas.
The key is to avoid assuming that every negative relationship proves cause and effect.
Use charts, correlation, regression, and real-world context to understand the relationship more clearly.
When used carefully, opposite movement can help you read data, compare variables, and make better-informed decisions.
FAQs
What does an opposite trend mean?
It means two variables tend to move in different directions. When one rises, the other often falls.
What is a simple example?
A common example is price and demand. When prices rise, demand may fall under normal market conditions.
Is it the same as inverse proportion?
No. A general negative pattern is broader. Inverse proportion is a specific mathematical relationship where one variable changes in reciprocal proportion to another.
How does it look on a graph?
A negative relationship often slopes downward from left to right, especially when the relationship is approximately linear.
Can the relationship be weak?
Yes. It can be weak if the variables move in different directions only loosely or inconsistently.
Does opposite movement always mean one variable causes the other?
No. The pattern can exist without direct causation. A third factor may influence both variables.
Where are negative relationships commonly used?
They are commonly discussed in economics, finance, statistics, science, business, engineering, and data analysis.
Why should I check more than one metric?
A single negative relationship can be misleading. Comparing multiple metrics helps you understand whether the pattern is stable and meaningful.
1 thought on “Inverse Trend: Meaning, Examples, Uses, and How to Identify It”